
The swan song march? An update on China’s Big Tech crackdown
- Our study on China’s measures on Big Tech firms in 2021 shows institutional investors had different beliefs from those in the retail-dominated equity market and remained unfazed by the crackdowns
- It suggests there are financial market barriers that prevent investors from exploiting or arbitraging away the performance discrepancy between Chinese bonds and equities through buying one and selling the other

The performance of the bond market versus the equities market in the aftermath of China’s tech crackdown in 2020 until last year diverged in a curious, significant way.

We have since sought to analyse this puzzling dichotomy at a more granular level: we investigated whether investors’ beliefs about the series of government measures on the Big Tech firms evolved differently over time. We also examined the effect of the Chinese government’s Big Tech crackdown of 2021 on a somewhat larger subset of Chinese tech companies and focused our attention on four key event dates.
We conducted a more systematic “event study” on seven large Chinese firms listed on the US Stock Exchanges for which we obtained both equity and bond price data around the four event dates.
The companies we analysed were: Alibaba Group Holding (BABA), Meituan (MEITUAN), JD.com (JD), Baidu (BIDU), Hello Group (MOMO), Tencent Holdings (TCEHY), and Tencent Music Entertainment Group (TME).
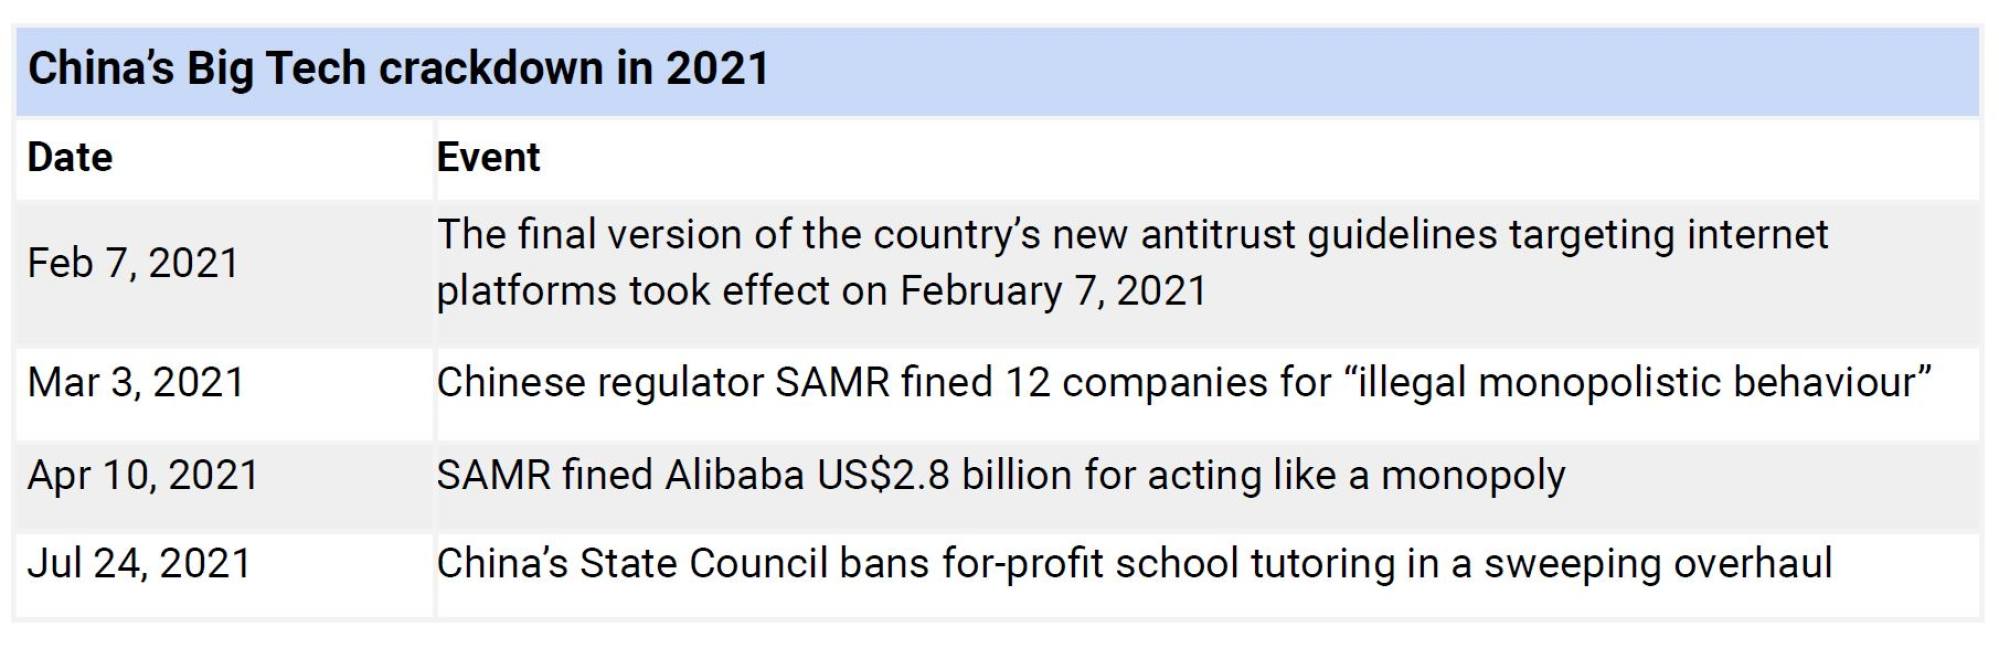
We ran our analysis on a daily basis over a -20-day to +20-day window around the event date, using the cumulative risk-adjusted performance methodology. The events studied were chosen to highlight milestones in the Chinese government’s crackdown through its State Council and the State Administration for Market Regulation (SAMR) over a six-month period in 2021.
The event study was conducted in four ways:
-
Bond minus Equity cumulative risk-adjusted performance by event date for each stock;
-
Bond minus Equity cumulative risk-adjusted performance across all stocks for each event date;
-
Bond minus Equity cumulative risk-adjusted performance across all event dates for each stock; and
-
Bond minus Equity cumulative risk-adjusted performance across all seven stocks and event dates.

An event study – which is an empirical methodology that is popular in financial literature and typically used to analyse how security returns respond to a particular event – uses cumulative abnormal returns as the measure of outperformance or underperformance. An abnormal return measures the deviation from the security’s expected return based on the index, while the cumulative abnormal return is the sum of all such returns over the event window.
Following this convention, we calculated the daily cumulative abnormal returns (CAR) from the spread between bond and equity returns, that is, the relative performance, for a window of 20 days before and 20 days after each event date. To exclude the possibility of attributing our findings to effects from the overall bond market, we subtracted the returns of a bond market index, the ICE BOFA China Corporate Index (USD), from the returns of the seven bonds, respectively. In a similar vein, we subtracted an equity index return, the Nasdaq Composite Index, from the seven equity returns, respectively.
A summary of the key results follows.

Figure 1 indicates a highly significant and positive CAR spread, that is, bonds outperforming stocks, for the various Chinese internet stocks over each event window, except for the event date February 7, 2021, when the final version of the country’s broad antitrust guidelines targeting internet companies first took effect. All the other three event dates had an effect on bond versus stock performance, with bonds outperforming stocks in almost all cases.

To examine the effect of the four events across all stocks, we averaged the bond versus stock cumulative risk-adjusted return spread across all stocks and analysed them for each event date. We looked for patterns in the spread over time, that is, if the market had learned anything new with the passage of time about the stringency of the new regime.
One would hence expect the return spread to diminish over these event times as the market gradually absorbs the information associated with the shocks. To the contrary, as Figure 2 indicates, the return spread appeared to be close to its highest on April 10, 2021, and July 24, 2021. This is surprising as April 10, 2021, and July 24, 2021, are the last two event dates in our sample period, months after the two previous “crackdowns” on February 7, 2021 and March 3, 2021.

The third event study test is reflected in the left chart of Figure 3, in which we examined each Chinese internet company’s overall reaction (bond versus equity CAR spread) averaged across all four event dates in 2021. The graph for Tencent (Tcent) showed the strongest CAR spread (or bonds outperforming stocks) averaged across all the event dates, at around 100 per cent, whereas JD.com (JD) appeared to have the weakest relative performance, at around 10 per cent.
Finally, the right chart of Figure 3 shows the summary effect of China’s Big Tech crackdown averaged across all seven internet platform companies and four event dates. It appears that the CAR spread showed an upwards trend on average.

If market participants had updated their prior beliefs about the true intentions of the Chinese government in reining in the Big Tech companies to achieve common prosperity for the nation, they would have expected to see the asymmetric risk-adjusted performance effect on the Chinese bond market versus stock market diminish over the event times.
That did not appear to be the case. Therefore, either the bond market investors had been irrational, leading to market inefficiencies, or the crackdown evolved very differently from what was initially announced. Nevertheless, the main participants in the bond markets, mostly institutional investors, had different beliefs from those in the retail-dominated equity market and remained unfazed by the succession of crackdowns.

As we concluded in the op-ed in September 2021, the reasons behind the Chinese government’s Big Tech crackdown may be complex and partly due to the widespread discontent with these companies, along with the widening wealth gap in China, which many have attributed to these digital platform companies.
That said, the regulatory events in the first seven months of 2021 indicate that either the Chinese bond market, dominated primarily by institutional firms, as opposed to the retail-heavy equity counterpart, is grossly inefficient, illiquid, and irrational, or the institutional money was still betting on China over that tumultuous six-month period. This relative performance pattern appears to continue at the index level more recently (November 2021 to early February 2022), although, for individual names, the results are mixed.
Our findings in this study shed light on how market participants reacted to the Chinese government’s series of crackdowns on the leading Big Tech companies. It appears that the relative performance between bonds and equities is not easily exploited by arbitrageurs, such as hedge funds, potentially due to market frictions between the bond and equity markets, financial capital moving slowly across the bond and equity markets, and behavioural biases due to differences between bond and equity investors. In other words, there are financial market barriers that prevent investors from exploiting or arbitraging away the performance discrepancy between Chinese bonds and equities through buying one and selling the other.
China’s regulators may ease the pressure on Big Tech companies in 2022
China remains an enigma for economists and others, vacillating from a country with a command-and-control form of free market to one with unexpected crackdowns of the same market by both the regulators and the Public Security Bureau on occasion.
Notwithstanding this proviso, those believing that they can exclude China’s capital markets from the global economy would be naive. Despite all the media hype, the breadth and depth of the financial markets in the world’s second-largest economy that has large trade surpluses with the other major economies (for example, the goods and services trade between the US and China totalled US$658 billion in 2021) mean that global investors have no choice but to look beyond the political rhetoric and continue to tie their fortunes with China.
Joseph Cherian is practice professor of finance at the National University of Singapore (NUS) Business School. Jingyuan Mo is adjunct assistant professor of business and mathematics at NYU Shanghai. Marti G. Subrahmanyam is the Charles E. Merrill Professor of Finance, Economics, and International Business at NYU Stern and NYU Shanghai. Tingyi Xiao is a recent graduate of the Master of Science programme at NUS Business School.
